Why Fast Price Moves Mislead Traders
Understanding What’s Really Happening in the Chart
Most traders assume that when a stock moves quickly, it must be “volatile.”
But fast movement and volatility are not the same thing—and confusing the two leads to shaken confidence, premature exits, and missed opportunities.
Velocity refers to how quickly price moves.
Volatility refers to how unstable price movement is.
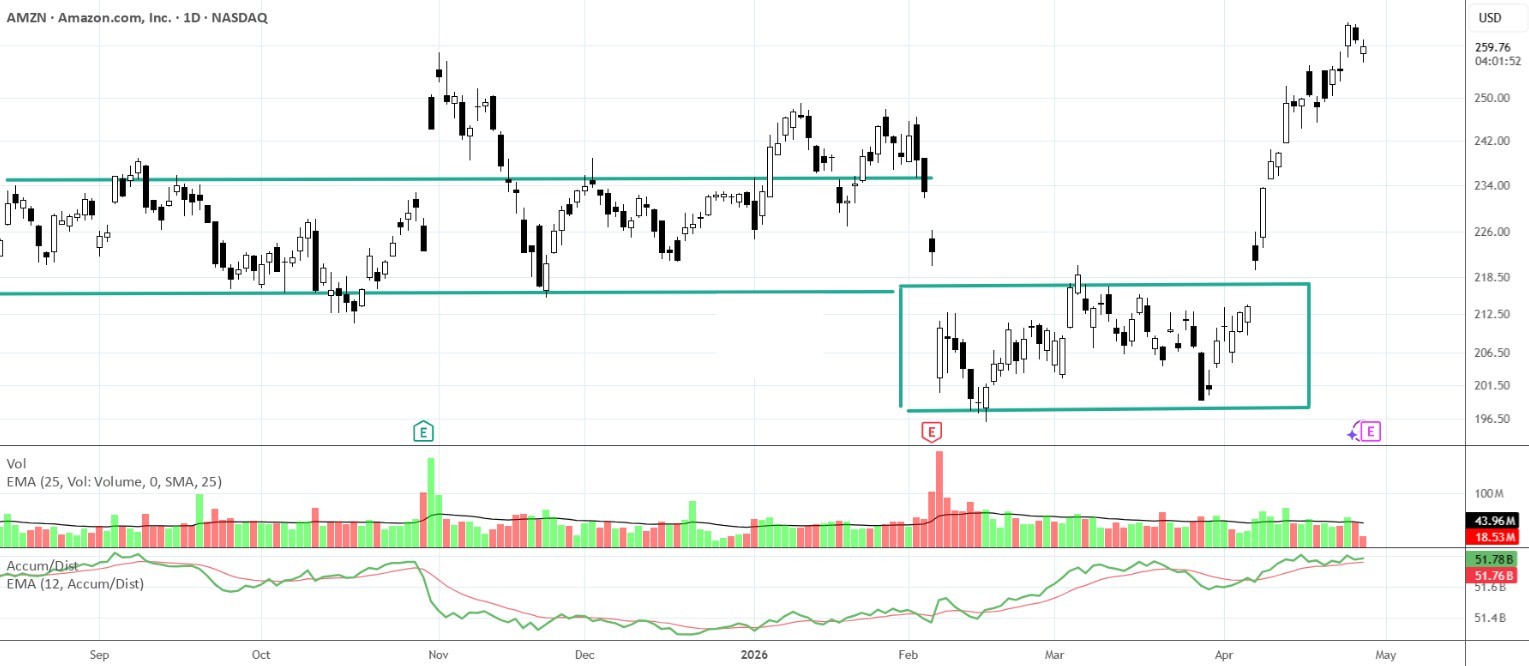
This week’s TradingView tutorial using AMZN highlighted a pattern we see constantly in modern markets:
price moving fast without actually being volatile.
Understanding this difference is one of the most important skills a trader can develop.
Most retail traders are taught to associate speed with danger.
So when a stock moves quickly, they assume:
But in the AMZN chart, the fast moves weren’t instability—they were institutional execution, a concept we explore in depth in our articles on Dark Pool trading and market structure.
Velocity often appears when:
None of these are “volatile” events. They’re normal mechanics of modern market structure.
Volatility is not fast.
Volatility is unstable.
A volatile chart shows:
This is the kind of environment where traders truly get chopped up.
AMZN’s chart this week showed the opposite: clean direction, strong follow‑through, and orderly structure.
Velocity, not volatility.
In this week’s TradingView lesson, AMZN displayed:
Many traders would have labeled the breakout “too volatile.” But the chart showed no instability—just speed.
This misunderstanding leads to:
When price moves fast, ask:
Is the structure stable?
If yes, it’s likely velocity.
Are the bars consistent?
If yes, it’s not volatility.
Is the direction clear?
If yes, institutions are likely driving the move.
Is the move part of a larger pattern?
If yes, it’s probably a continuation, not chaos.
These are the same principles we teach in our technical analysis and swing trading educational articles.
Velocity is a normal part of today’s market environment.
Algorithms, Dark Pools, and institutional execution create fast but orderly price movement.
Volatility, on the other hand, is becoming less frequent but more extreme when it does appear.
Traders who learn to distinguish the two gain:
This is why understanding market structure is essential for modern traders.
Martha Stokes, CMT presented Volatility vs. Velocity: How to Trade Consistently in Fast-Changing Markets at the Synergy Traders Event recently. Watch it below.
This webinar expands on: